Agricultural Monitoring · Sample analysis
Crop block · Kerley Rd (Rt 1717)
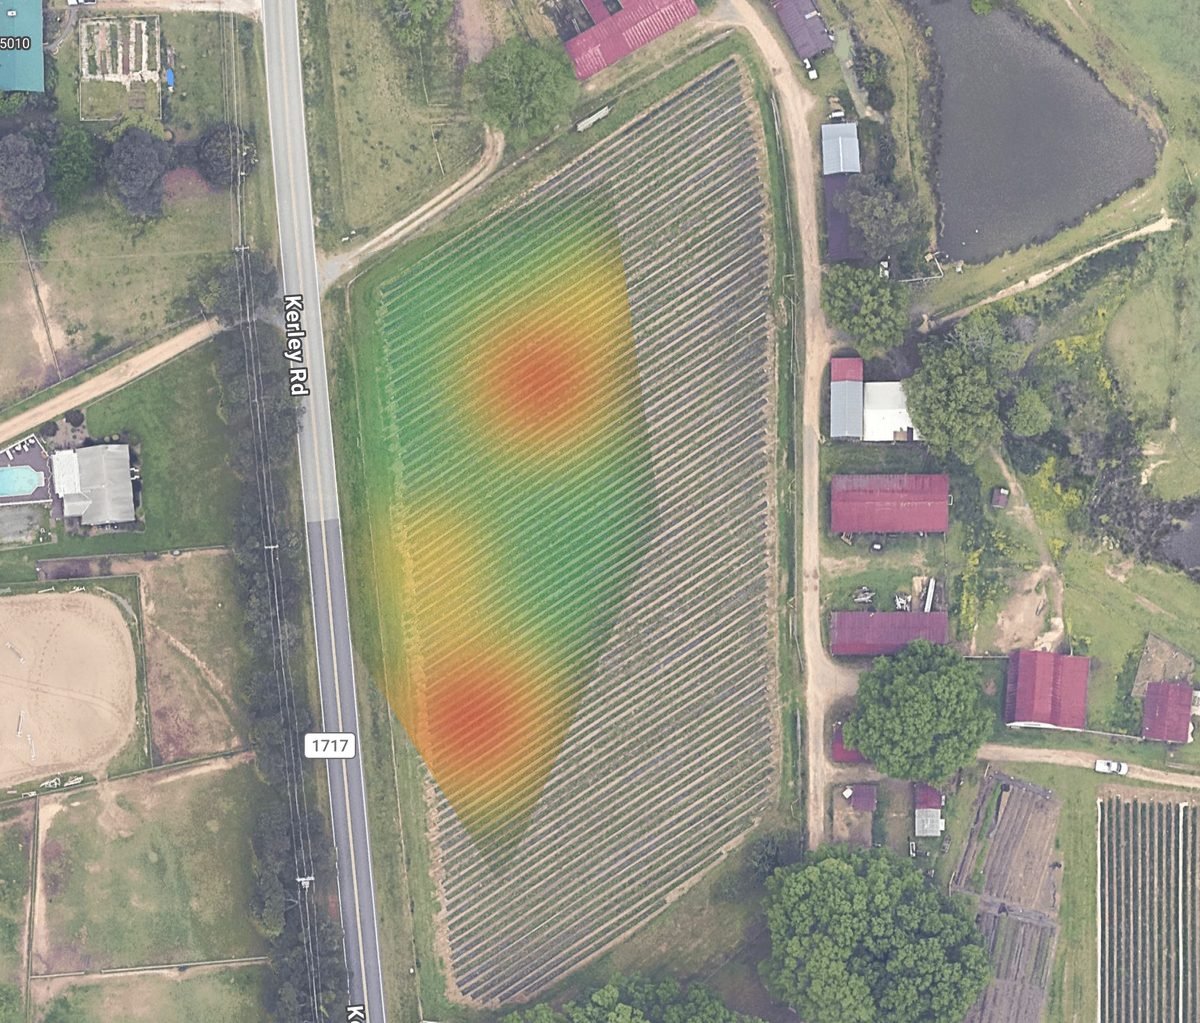
Healthy season — two zones to scout
Canopy vigour is strong and uniform across most of the block. Two lower-vigour patches and ample irrigation access are the items to act on.
Executive summary
Across the 9.1 ha block, canopy vigour is strong and even — mean NDVI 0.71 with healthy reflectance over roughly 95% of the field. Two below-average zones totalling 0.43 ha (4.7% of the block) are the only concern, and they grew about 0.11 ha in the last 30 days, so they warrant a ground scout this week. Water access is a strength (on-site pond, no waterlogging). With a small, targeted intervention the block is on track to its yield potential.
Change since last pass
Site snapshot
Vigour scorecard
Key findings
OBSERVED seen in imagery · AI-INFERRED model estimate
Uniform, vigorous canopy across the block
Crop rows show consistent, healthy reflectance over most of the ~9 ha field — no broad die-back or gaps in establishment.
0.43 ha of low-vigour area (4.7% of block)
Two zones — A (0.26 ha, −9% NDVI) and B (0.17 ha, −12% NDVI) — read measurably below the field average. Early sign of moisture, pest, or soil variation; worth ground-scouting this week.
Strong irrigation access (adjacent pond)
An on-site pond on the northeast boundary provides a close water source, reducing drought exposure for the block.
No standing water or drainage failure
No ponding or waterlogged areas detected within the rows after recent weather — drainage appears adequate.
Clean field edges and service tracks
Headlands and access tracks are clear; no visible encroachment or unmanaged scrub advancing into the planted area.
Field health — what the imagery answers
Each question is scored 0–10 and labelled OBSERVED (seen in imagery) or AI-INFERRED (modelled).
Is the crop establishing evenly across the block?
8.5/10Yes — canopy reflectance is consistent over ~95% of the field, indicating even establishment with no broad gaps or die-back.
Where is vigour below the block average?
7.0/10Two zones totalling 0.43 ha: Zone A mid-field (0.26 ha, −9% NDVI) and Zone B lower-field (0.17 ha, −12% NDVI).
Is there a water or drainage problem?
8.5/10No ponding or waterlogging is visible after recent weather, and the adjacent pond gives close irrigation access — drought exposure is low.
Is the stress spreading versus the last pass?
6.5/10The low-vigour area grew about 0.11 ha in 30 days — still early and contained, but trending the wrong way. Worth scouting now.
Are field edges and access clean?
8.0/10Headlands and service tracks are clear; no encroachment or unmanaged scrub is advancing into the planted area.
Estimated economic impact
If stress in the 0.43 ha persists untreated, modelled yield loss across those zones is ~3–5% of their potential — on a block at typical row-crop margins, roughly $900–1,600 this season. Scouting and a targeted intervention now is far cheaper than the loss, which is the core return on continuous monitoring.
Recommended actions
- NowScout Zone A & B on the ground
Walk the two flagged patches (0.43 ha) this week and identify the cause — moisture, pest, or soil — before the stress spreads further.
- SoonTargeted, zone-only intervention
Apply the right fix (irrigation, treatment, or soil amendment) to the two zones rather than the whole block, protecting yield at minimum input cost.
- MonitorRe-scan on the next pass
Confirm the zones recover and the low-vigour area stops growing; track mean NDVI through the rest of the season.
Agricultural Monitoring analysis
This block is having a strong season. Across roughly nine hectares the canopy reads as uniform and vigorous, which is the clearest satellite signal that establishment went well and the crop is tracking to potential. There is no broad stress, gapping, or die-back.
Two patches are worth a closer look. One mid-field and one in the lower field read below the block average — exactly the kind of early divergence that is invisible from the road but obvious from above. The cause could be moisture, a pest hotspot, or a soil change; a quick scout of those two zones will tell you which, while there is still time to respond.
Water is a strength here: the adjacent pond gives the block a close irrigation source and lowers drought risk relative to rain-fed fields. Drainage also looks adequate — no ponding showed up in the rows after recent weather.
For an operation running many fields, the value is triage: continuous monitoring tells you which blocks are fine and which need boots on the ground this week. Instead of walking everything, you walk the two zones the imagery flagged — and you catch problems while they are still small and cheap to fix.
The full report · 13 sections
This sample demonstrates 4 of the 13 sections your live report includes. Highlighted rows are shown above; the rest are generated for paying accounts.
- 01Plant health & vitalityin this sample
- 02AI action recommendationsin this sample
- 03Soil & terrainin this sample
- 04Productivity & investment
- 05Environmental & operational
- 06Enterprise
- 07Perimeter & intrusion
- 08Asset & inventory
- 09Environmental riskin this sample
- 10Crop-yield prediction
- 11ESG reporting
- 12Water rights & usage
- 13Carbon-credit monitoring
Methodology & data sources
This sample is built from a single high-resolution reference frame with an illustrative NDVI vigour layer. Production reports derive vigour from multispectral satellite passes (red and near-infrared bands; NDVI and related indices) captured on a regular cadence through the season, with change measured pass-over-pass. Areas are estimated from the field boundary; economic figures are modelled at typical row-crop margins and are indicative, not a guarantee.
Want this for your property?
Enter any address or coordinates — your report lands in your inbox and dashboard.
Sample / demonstration report. Findings are illustrative and not a survey, appraisal, or legal advice. © PropOrbit.